Grammarly had a problem. Their North Star Metric was “suggestions accepted” — a classic engagement metric that went up and to the right. Then they realized something uncomfortable: their best users had fewer suggestions remaining, not more accepted. The metric that made the dashboard look good was measuring the wrong thing.
This is not just a Grammarly problem. Every product team that adds AI capabilities runs into the same trap. AI makes users faster, which means they spend less time in your product, which means your engagement metrics go down — even as the value you deliver goes up. I call this The Efficiency Paradox, and it breaks the fundamental assumption that North Star Metrics were built on.
What Is a North Star Metric?
A North Star Metric (NSM) is the single number that captures the core value your product delivers to customers. Sean Ellis, who coined the term, was clear: it is not a revenue metric. It is a value metric. Revenue is a lagging indicator of value delivered.
Amplitude’s North Star Framework organizes products into three “games” — attention (time spent), transaction (volume completed), and productivity (tasks accomplished). Spotify plays the attention game: time spent listening. Airbnb plays the transaction game: nights booked. Slack discovered that teams crossing 2,000 messages retained at 93% — a value threshold, not a vanity number.
The framework works well for traditional products. For AI products, it falls apart.
The Efficiency Paradox
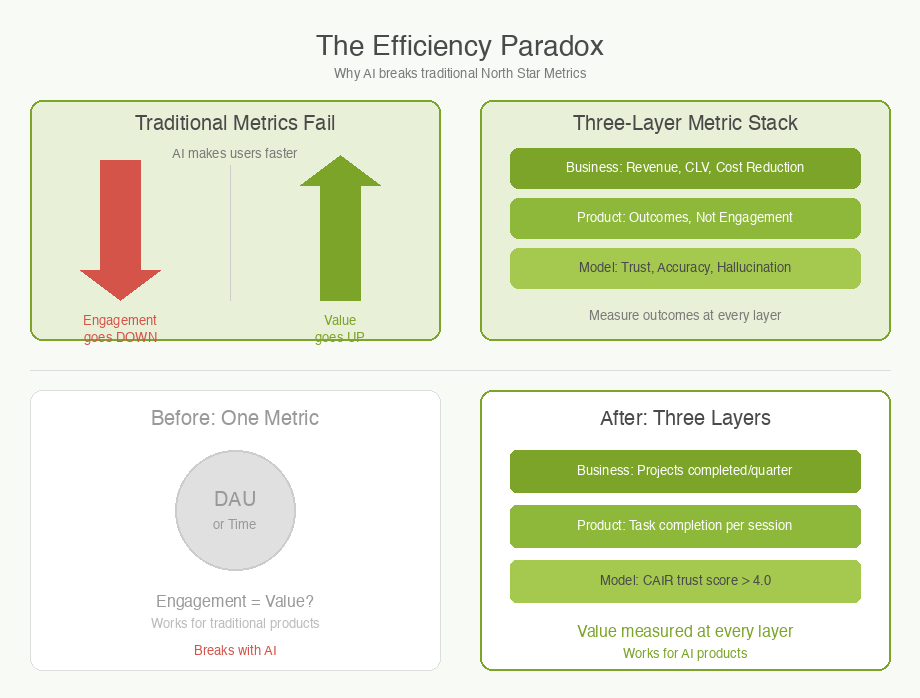
Here is the core tension. Traditional NSMs assume that more engagement equals more value. But AI products are designed to reduce effort. When your AI feature works perfectly, the user finishes faster and leaves sooner.
The data is striking. Irving Wladawsky-Berger’s research on the AI productivity paradox found that developers using AI complete 21% more tasks and merge 98% more pull requests — but PR review time increases 91%. The bottleneck does not disappear. It shifts.
Even more surprising: developers take 19% longer to complete issues with AI, yet believe it sped them up by 20%. The perception gap is real, and it means your users will tell you AI is helping even when your metrics say otherwise.
Elena Verna, who studies AI growth patterns, estimates that 60-70% of traditional growth tactics no longer apply to AI products. Time spent goes down. Daily active users may go down. But value goes up. If your NSM cannot see that distinction, you are optimizing for the wrong thing.
What Smart Companies Measure Instead
The companies getting this right have shifted from input metrics to outcome metrics.
Grammarly pivoted from “suggestions accepted” to “suggestions remaining.” Fewer remaining errors is a better signal than more clicks on the accept button. The shift from measuring your product’s activity to measuring the user’s result is the pattern.
GitHub Copilot tracks three metrics simultaneously: acceptance rate (27-30%), code retained after 30 days (88%), and PR cycle time (reduced from 9.6 to 2.4 days). No single number captures the value. Notably, acceptance rate is increasingly called a vanity metric — it does not capture thinking assistance, only typing assistance.
Notion doubled AI feature adoption by bundling it into standard plans at no extra charge. Their metric is adoption rate (50%+), not usage volume. They bet that broad adoption creates stickiness.
The Three-Layer Metric Stack
I have found a framework useful for thinking about AI product metrics. Instead of one North Star, AI products need a three-layer stack:
Business layer. Revenue impact, cost reduction, customer lifetime value. This is what the board cares about. Example: “Reduced support costs by 20%.”
Product layer. Adoption, activation, retention — but measured as outcomes, not engagement. Example: “50% of users complete their task in one session” instead of “average session length.”
Model layer. Accuracy, latency, hallucination rate, and trust. This is unique to AI products. LangChain introduced a metric called CAIR — Confidence in AI Results — that measures user trust, not model accuracy. The distinction matters: accuracy is table stakes, but confidence determines whether users actually rely on the output.
An Example: ProjectFlow Adds AI
ProjectFlow, a fictional project management tool, adds an AI feature that auto-generates weekly status updates from team activity. Their existing NSM is “weekly active projects.”
After launching the AI feature, weekly active projects stays flat. But something interesting happens: teams using the AI feature log in less frequently. The PM panics — engagement is down.
Then they look at outcomes. Teams using AI status updates are completing projects 15% faster. Project leads are spending zero minutes writing status reports (down from 45 minutes per week). And satisfaction scores for the status update feature jumped from 3.2 to 4.6 out of 5.
The old NSM could not see any of this. ProjectFlow shifts to a three-layer approach: business (projects completed per team per quarter), product (time-to-first-status-update under 5 minutes), and model (status accuracy rated by project leads). The dashboard gets simpler, but the signal gets clearer.
Common Metric Mistakes for AI Products
Measuring acceptance rate as your NSM. Acceptance rate tells you how often users click “accept” on an AI suggestion. It does not tell you whether the output was valuable, whether it saved time, or whether the user trusted it enough to keep it. Use retention of AI-generated output instead.
Treating daily active users (DAU) as a health metric. For AI productivity tools, fewer visits can mean the product is working. Track task completion per session instead of sessions per week.
Ignoring the trust layer. One-third of generative AI users encountered incorrect or misleading answers in 2025. If you do not measure hallucination rate and user corrections, you are flying blind on the dimension that will determine long-term retention.
How to Use With AI
AI can help you find the right metrics faster than manual analysis.
Identify leading indicators. Export your retention data alongside AI feature usage. Ask Claude: “Which behaviors in the first 7 days most strongly predict 30-day retention? Separate users who engaged with AI features from those who did not.” This surfaces candidate NSMs you would not find in a dashboard.
Stress-test your current NSM. Describe your product and current NSM to an AI and ask: “If our AI feature works perfectly and users accomplish their goal in half the time, what happens to this metric? What would be a better metric that captures value delivered?” The Efficiency Paradox test.
Build a metric scorecard. Ask an AI to generate a three-layer metric stack for your product type, with one metric per layer. Then validate each against the test: “If this metric changed 20% tomorrow, would we do something different?”
The guardrail: AI can find correlations in your data and suggest metric frameworks. It cannot tell you which metrics align with your strategy. Choosing your NSM is a Plan-phase decision that shapes every team’s priorities. That judgment is yours.
Why This Matters
Choosing the wrong NSM for an AI product is not a measurement error. It is a strategy error. When Grammarly measured “suggestions accepted,” every team optimized for more suggestions. When they switched to “suggestions remaining,” every team optimized for better writing. Same company, same product, different metric, fundamentally different incentives.
In the 5Ps framework, the NSM sits in the Plan phase alongside product vision and strategy. It is the number that translates your vision into daily decisions. Get it right and teams self-organize around value. Get it wrong and you spend your time chasing engagement while your users quietly get less from your product.
The Efficiency Paradox is not going away. As AI gets better, the gap between engagement and value will widen. The PMs who recognize this early — and rebuild their metrics accordingly — will build products that last.
What do you think? I would love to hear how you measure AI product value. Comments are gladly welcome.
Leave a Reply
You must be logged in to post a comment.