Category: Product

  • Developer Experience as a Product

    Developer Experience as a Product

    I once watched a team spend nine months building a payment processing API that was, by every technical measure, excellent. Fast, reliable, well-architected. They launched it with a blog post, a three-page quickstart guide, and a Swagger page. Six months later, adoption was flat. Developers would sign up, try the sandbox for an afternoon, and disappear.

    The API wasn’t the problem. The experience of using the API was the problem. The quickstart assumed you already understood webhooks. The error messages returned cryptic codes with no explanation. The SDK had no code examples in the language most of their target developers actually used.

    This is a pattern I have seen repeated across many companies: brilliant technology wrapped in a terrible experience. And it happens because most teams treat developer tools, documentation, and onboarding as afterthoughts. The insight that changed my thinking is simple: developer experience is the product.

    What Is Developer Experience?

    Developer experience — sometimes shortened to “DevEx” or “DX” — is the sum of every interaction a developer has with your tools, documentation, APIs, SDKs, and support channels. It is the developer equivalent of user experience.

    Just as a consumer product PM thinks about the end-to-end user journey, a DevEx-focused PM thinks about the developer journey. How does a developer discover your API? How quickly can they get a “Hello World” response? What happens when something breaks at 2 AM?

    The concept isn’t new. But what’s changed is treating it with the same rigor as any other product: with its own roadmap, its own user stories, its own metrics, and its own dedicated team.

    The Components of Great Developer Experience

    1. Time to First Value

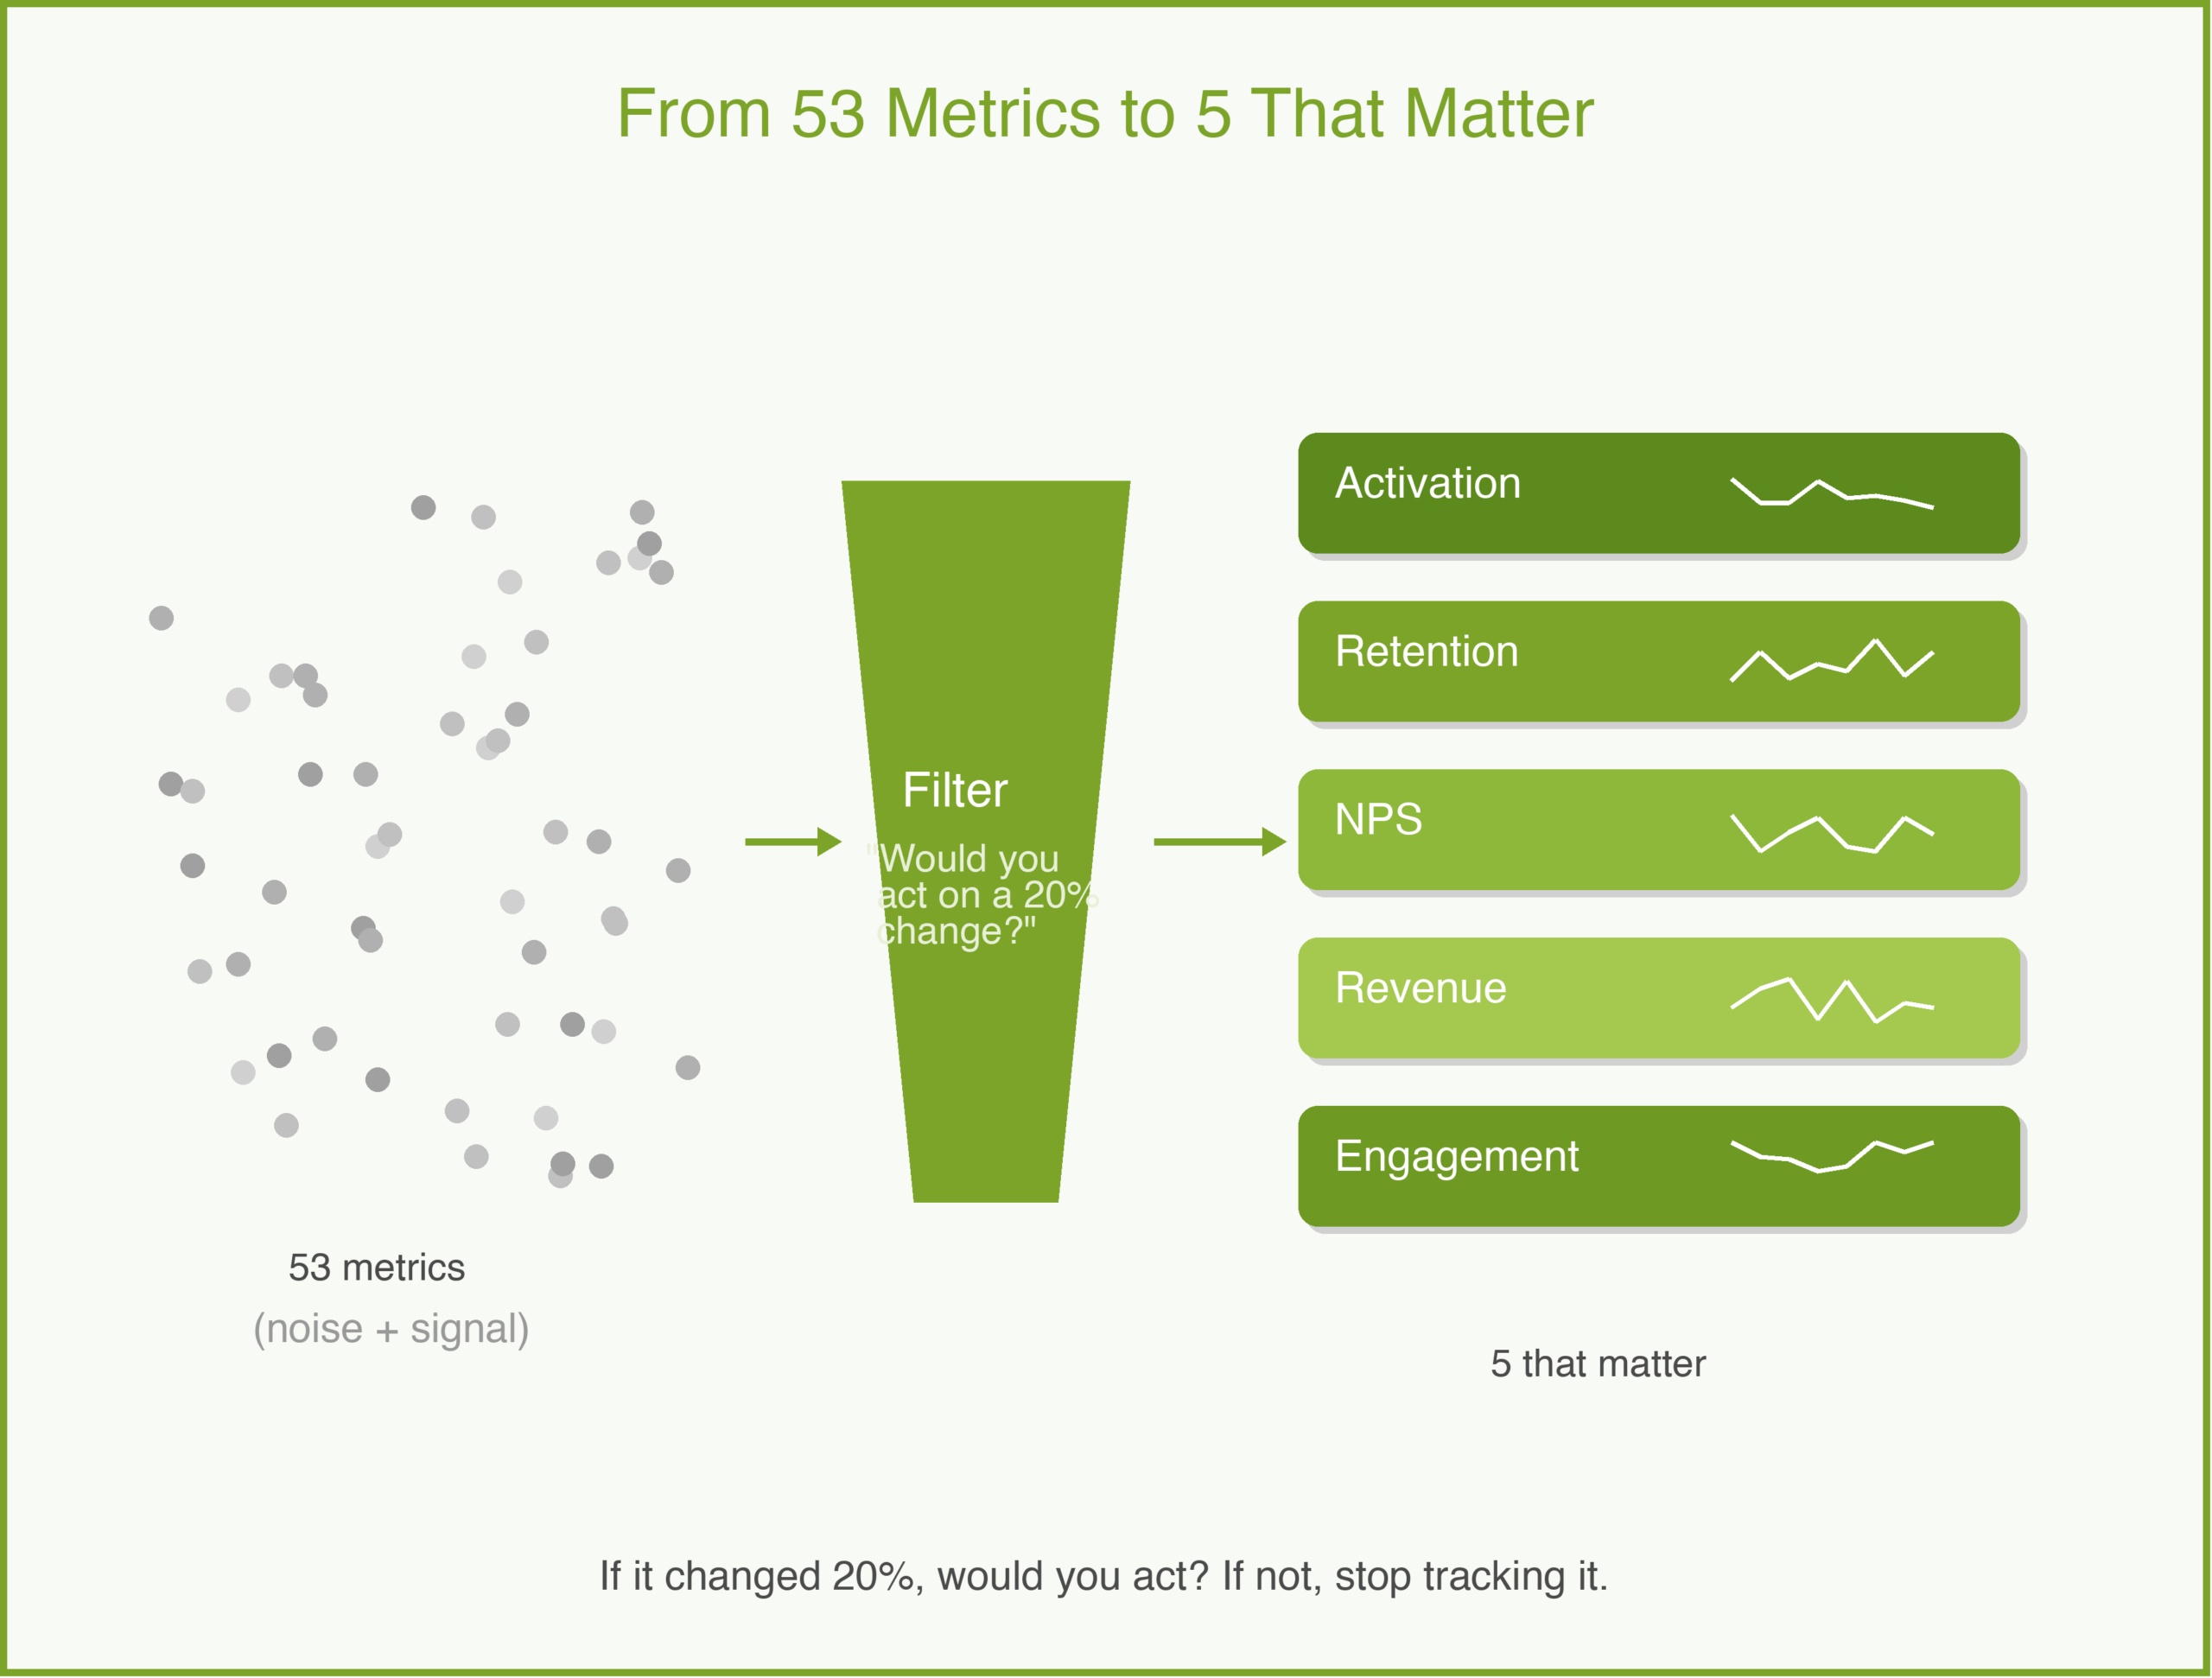
    The single most important metric in DevEx is “time to first value” — how long it takes a developer to go from “I just signed up” to “I got something working.” The best developer products obsess over this number.

    This is where most platforms lose developers. The signup is fine. But then the developer lands on a documentation page with twelve prerequisite steps and three required configuration files. They close the tab.

    2. Documentation as Product

    Documentation is not a chore you hand off to a technical writer after launch. It is a core product surface. Every page is an interface. Every code sample is a feature.

    Good documentation answers three questions in order: What is this? How do I start? What do I do when it breaks?

    3. Error Messages That Teach

    When a developer hits an error, that is a product moment. A message that says “400 Bad Request” teaches nothing. A message that says “The ‘currency’ field is required and must be a three-letter ISO 4217 code (e.g., ‘USD’)” teaches the developer how to fix the problem without leaving their editor.

    4. SDKs and Libraries

    An API is a contract. An SDK is an experience. Developers don’t want to write raw HTTP calls. They want to call client.payments.create() in their language and have it work.

    A Concrete Example: CodeBridge

    Imagine a company called “CodeBridge” that provides payment processing APIs. They have a solid API — reliable, well-tested, good uptime. But developer adoption has stalled.

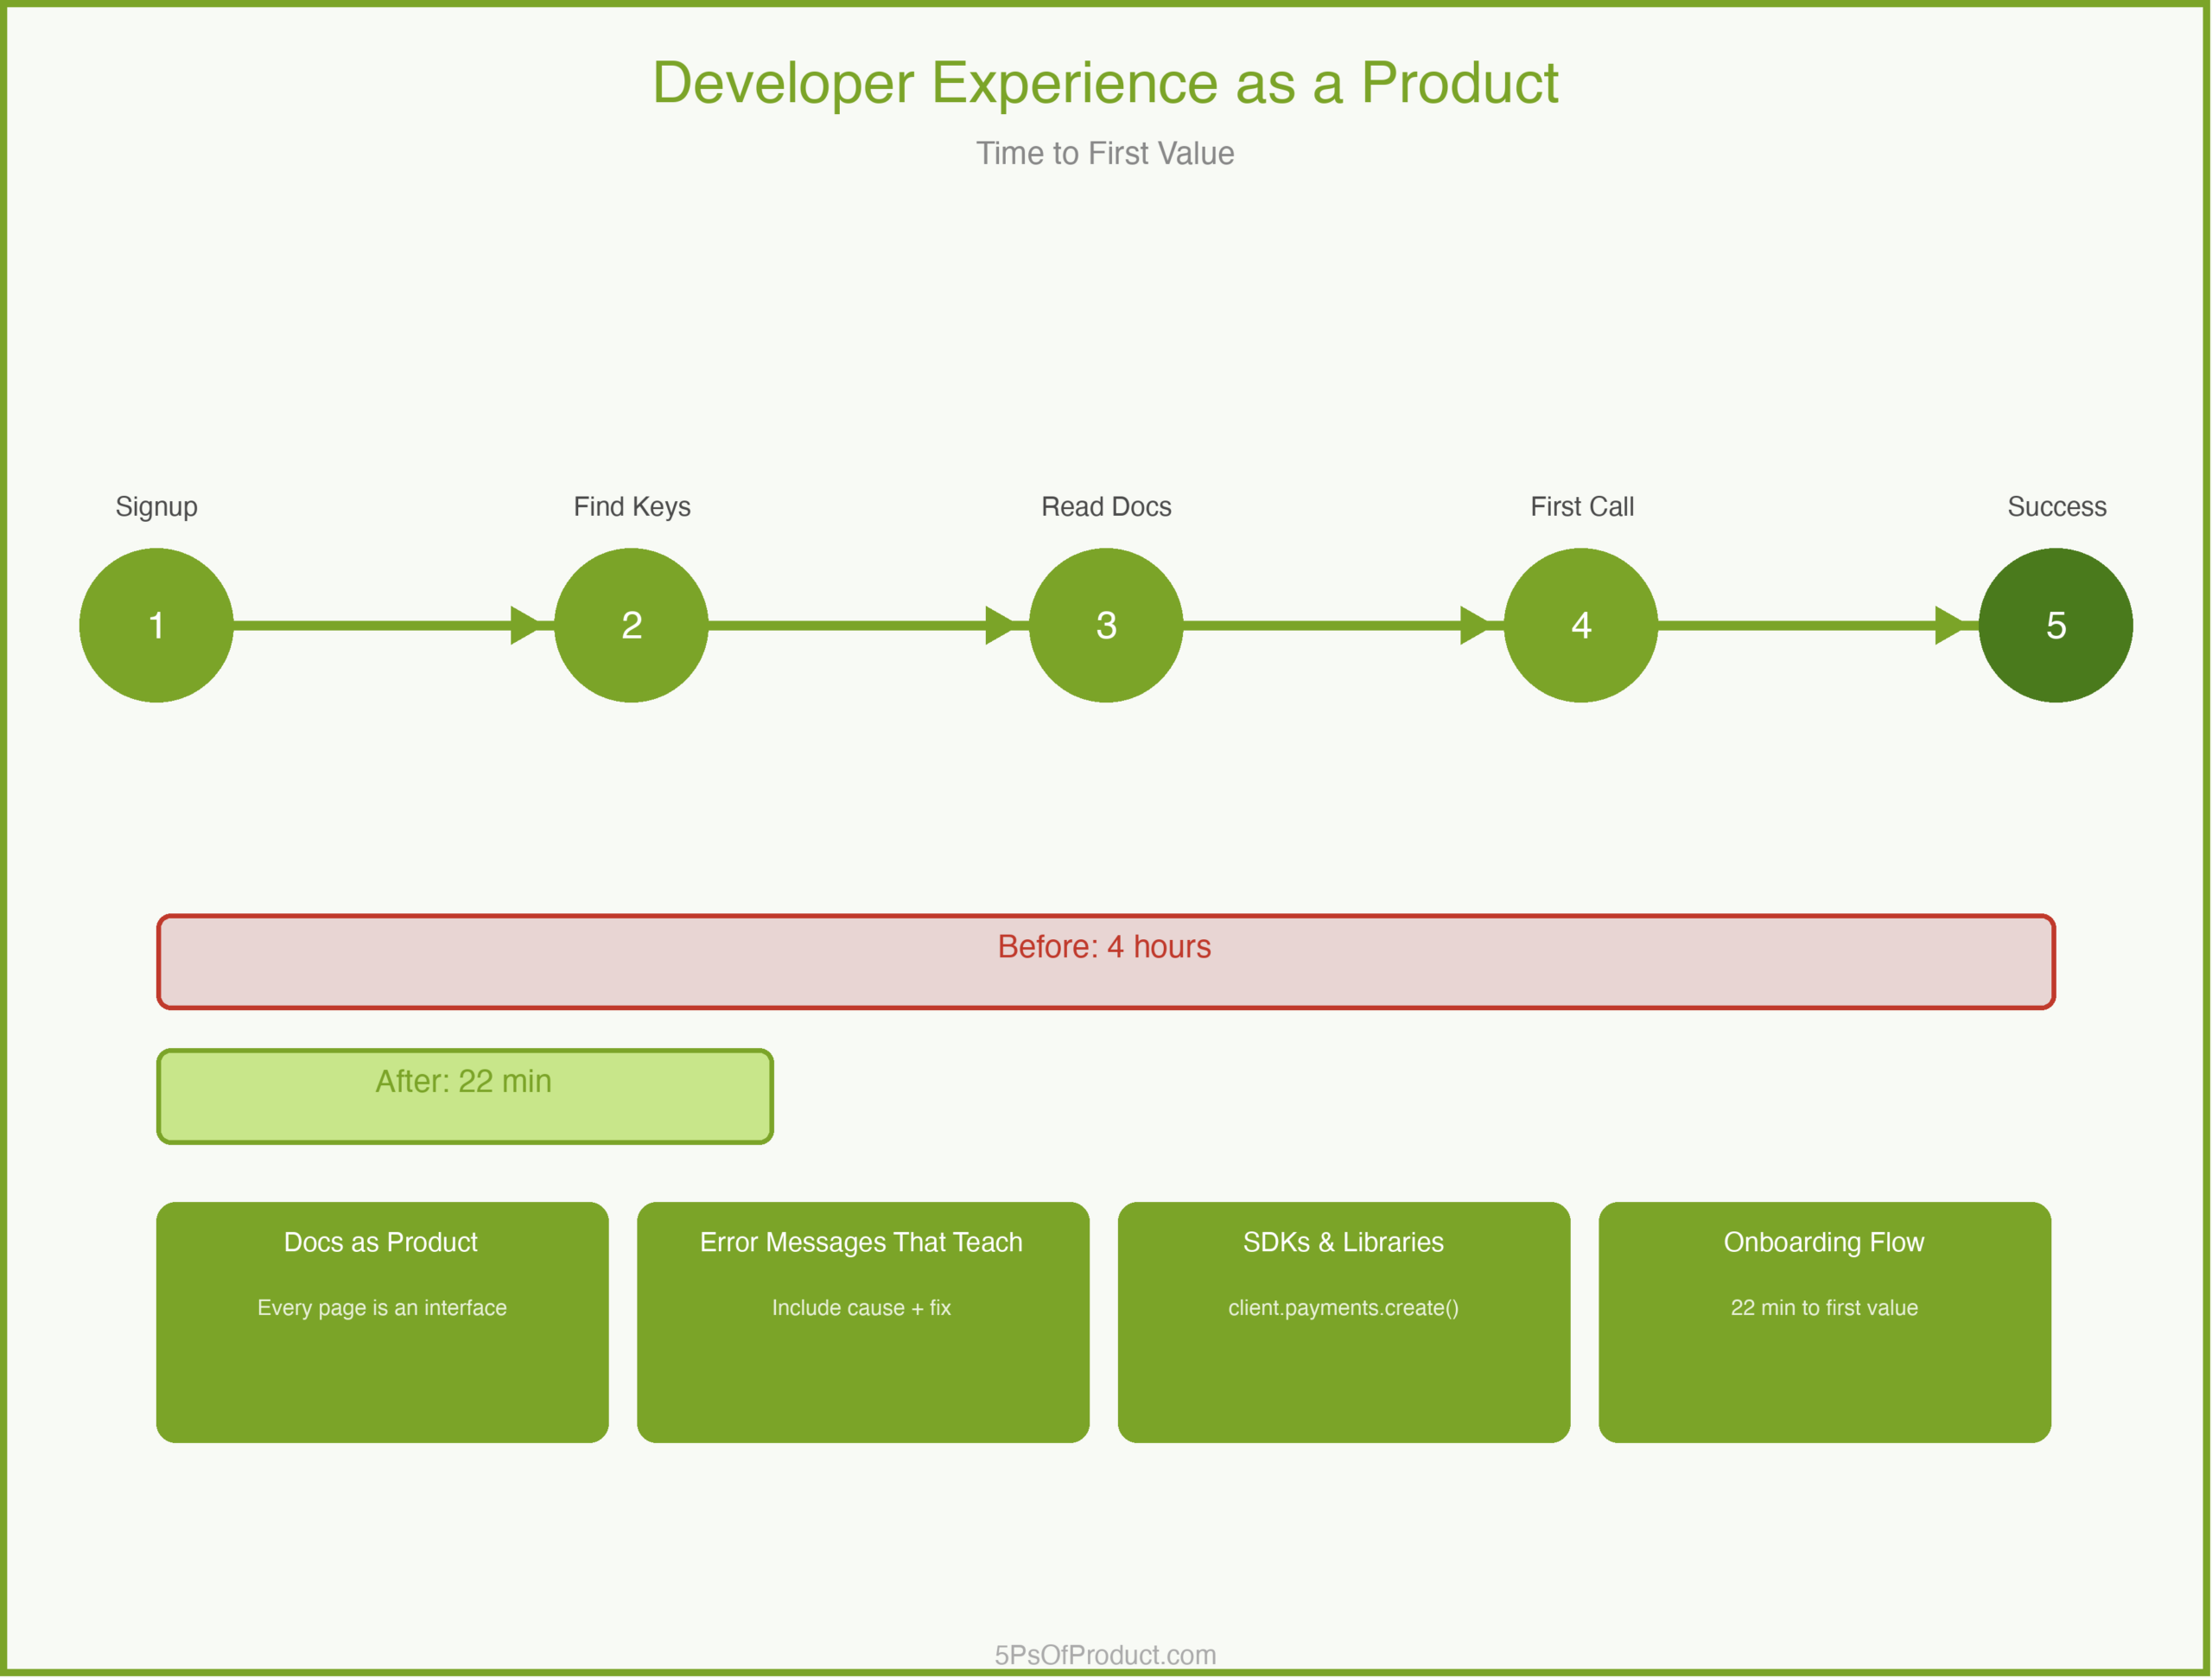
    CodeBridge’s PM conducted a “developer journey audit.” She signed up as a new user and tried to process her first test payment. Finding the API keys took eight minutes (buried in a settings submenu). The quickstart assumed familiarity with OAuth 2.0. The first code sample used a language her target market rarely used. The sandbox returned an error with no context.

    Total time to first successful payment: four hours.

    The fix wasn’t to rebuild the API. It was to treat each friction point as a product bug. They built an interactive onboarding wizard that generated API keys inline. They rewrote the quickstart for the three most popular languages. They added contextual error messages. They put analytics on every documentation page to see where developers dropped off.

    Within three months, time to first value dropped from four hours to twenty-two minutes. Adoption doubled.

    The Documentation Roadmap

    Here is an idea that surprises some PMs: your documentation should have its own roadmap, prioritized by developer impact, just like your product roadmap.

    A documentation roadmap might include: rewriting quickstart guides for top languages, building an error code reference with searchable troubleshooting guides, creating end-to-end tutorials for common use cases, and adding versioned docs for older API versions.

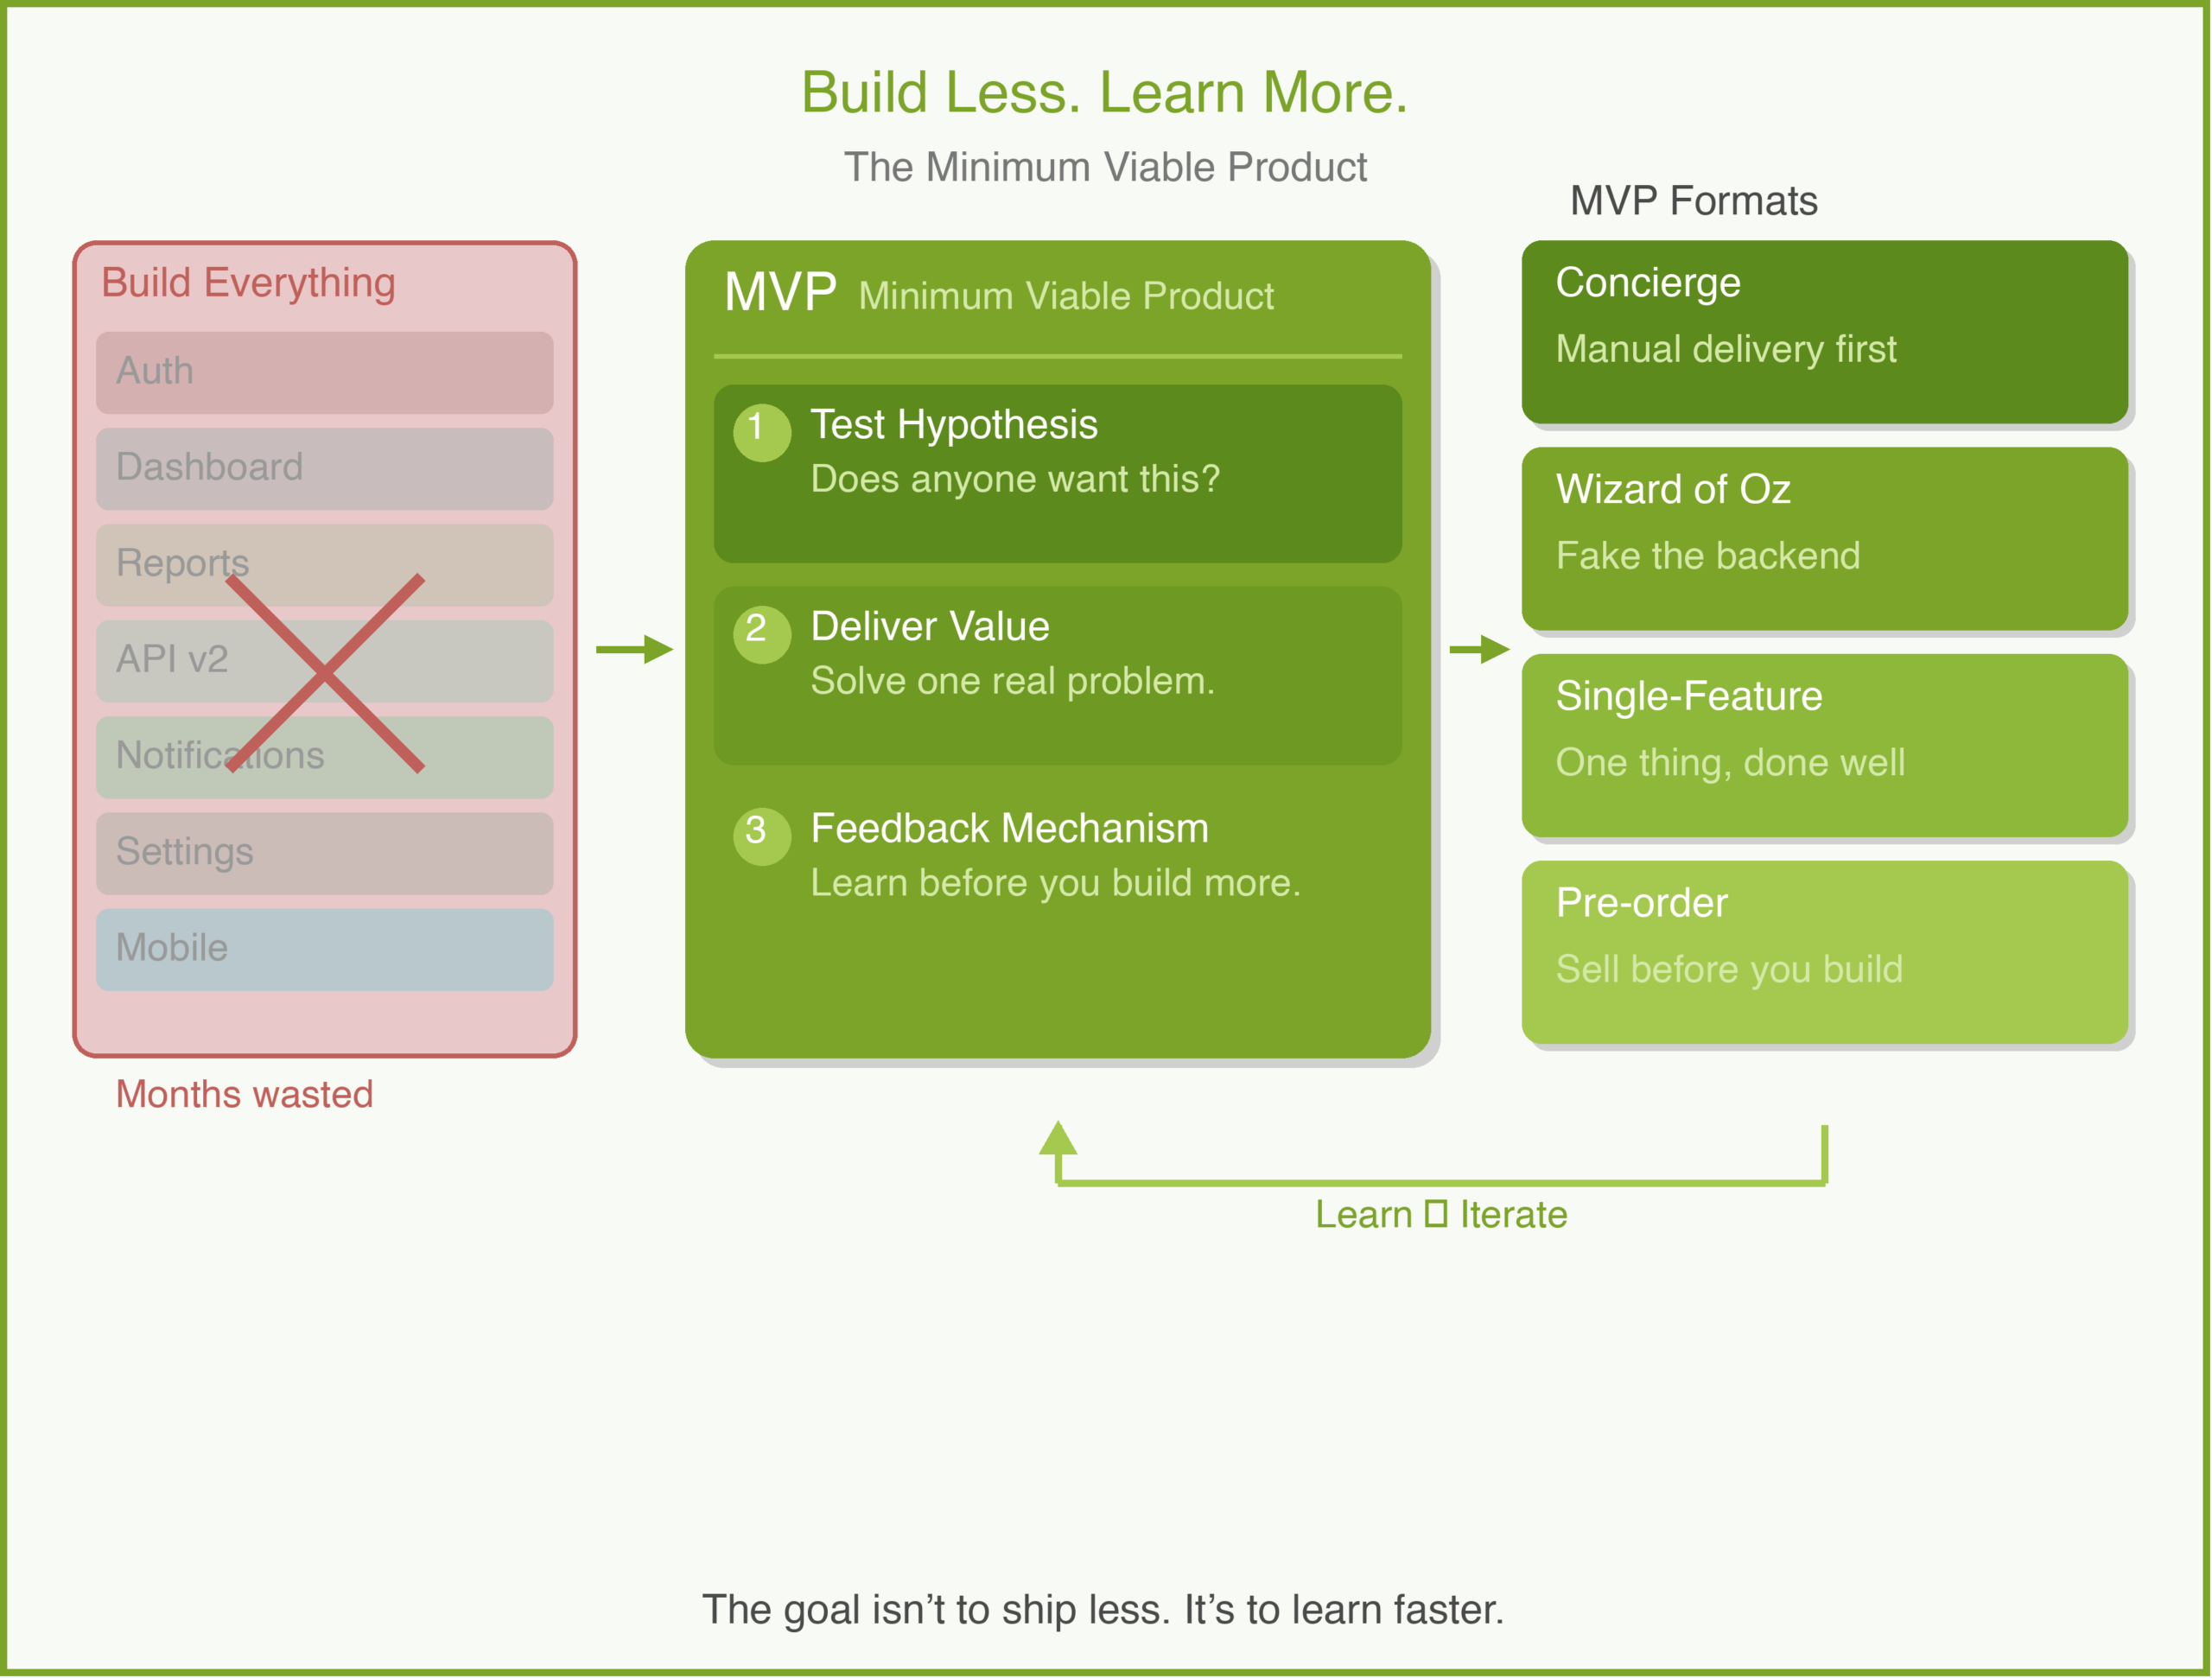
    Each item maps to a developer pain point, measured by support ticket volume, documentation page bounce rates, or sandbox completion rates. This is the MVP approach applied to documentation: ship the highest-impact improvements first, measure, iterate.

    Why This Matters

    Treating developer experience as a product matters because developers are your distribution channel. When a developer has a good experience with your platform, they bring it to their next company. When they have a bad experience, they warn their peers.

    Developer trust is hard to earn and easy to lose. A single breaking change without a migration guide, a single undocumented behavior that causes a production outage — these become stories that spread through developer communities.

    The companies that win in developer tools aren’t always the ones with the best technology. They are the ones with the best experience.

    How to Use With AI

    AI is useful for the mechanical parts of developer experience — the work that’s critical but tedious.

    1. Documentation Gap Analysis

    Paste your existing API reference and quickstart guide and ask it to find gaps from a beginner’s perspective.

    Prompt: “Read this quickstart guide. Act as a junior developer who has never used a payment API before. List every assumption this guide makes that isn’t explained. For each gap, suggest a one-sentence clarification.”

    2. Error Message Improvement

    Feed your current error codes and messages and ask for developer-friendly rewrites.

    Prompt: “Here are our current API error messages. For each, rewrite it to include: (1) what went wrong, (2) the most likely cause, and (3) how to fix it. Keep each message under 50 words.”

    3. Code Sample Generation

    When you need examples in multiple languages, draft one canonical example and ask AI to translate it.

    Prompt: “Here is our payment creation example in Python. Translate it to JavaScript (Node.js), Ruby, and Go. Preserve the comments explaining each step. Use idiomatic patterns for each language.”

    Guardrail: AI can generate documentation and code samples quickly, but a human developer must test every example end-to-end before publishing. An AI-generated code sample that doesn’t compile is worse than no sample at all.

    Conclusion

    Developer experience is not a nice-to-have layered on top of your real product. It is your product, experienced through documentation, error messages, SDKs, and onboarding flows. Treating it with the same rigor as your core API is what separates platforms that developers love from platforms that developers tolerate.

    What do you think? Comments are gladly welcome.

  • Product Analytics: Measuring What Actually Matters

    Product Analytics: Measuring What Actually Matters

    A few years ago, I inherited a product with a beautiful analytics dashboard. Fifty-three metrics, real-time updates, color-coded trends. The team was proud of it. When I asked which three metrics mattered most for our next decision, nobody could answer.

    That is the analytics trap. Measuring everything is easy. Measuring what matters is hard. And the difference between the two is the difference between a team that makes decisions and a team that makes dashboards.

    Vanity Metrics vs. Actionable Metrics

    A vanity metric is a number that goes up and makes you feel good but does not inform a decision. Total registered users is a vanity metric — it never goes down, and it does not tell you whether anyone is getting value from your product.

    An actionable metric tells you something you can respond to. Weekly active users who complete a core action is actionable — if it drops, you investigate. If it rises after a change, you know the change worked.

    The test is simple: if this metric changed by 20% tomorrow, would you do something different? If yes, it is actionable. If no, it is vanity. Stop tracking it.

    Metrics by Product Stage

    The right metrics change as your product matures. What matters at launch is different from what matters at scale.

    Pre-launch and early access. You are looking for signals that people care. Track activation rate (what percentage of signups complete the core action?), time-to-value (how long from signup to first meaningful use?), and qualitative feedback volume. At this stage, one customer using your product daily is more valuable than a thousand signups.

    Growth stage. Retention is the only metric that matters. If people come back, you have something. If they do not, no amount of acquisition will save you. Track weekly or monthly retention cohorts, not just averages. A 40% month-one retention that drops to 5% by month three tells a different story than a steady 25%.

    Maturity and scale. Revenue metrics take center stage. Customer lifetime value (LTV — total revenue from a customer over their relationship with you), customer acquisition cost (CAC — what you spend to win each customer), and the ratio between them tell you whether your business model works. Net revenue retention tells you whether existing customers are expanding or shrinking. At this stage, you are optimizing a machine, not searching for signal.

    An Example: MetricFlow

    MetricFlow is a fictional B2B tool that helps sales teams track pipeline health. At launch, the team tracks everything — page views, clicks, time on page, feature usage for all 12 features, daily active users, weekly active users, monthly active users.

    Their dashboard is crowded and nobody uses it. So they ask: what is the one thing that tells us whether a customer is getting value?

    After analyzing churned vs. retained accounts, they find a strong predictor: teams that create at least 3 custom pipeline views in their first week retain at 4x the rate of teams that do not. That becomes their North Star — “first-week custom views.” Every product decision gets tested against it: does this change make it more likely that a new team creates 3 custom views in week one?

    Their dashboard goes from 53 metrics to 5. Weekly new teams. First-week activation rate. Custom views created. 30-day retention by cohort. NPS from accounts past 90 days. Everything else is available in the data warehouse if someone needs it, but it is not on the dashboard.

    The HEART Framework

    One framework I have found useful is Google’s HEART framework, first described by Kerry Rodden, Hilary Hutchinson, and Xin Fu in their original 2010 paper: Happiness, Engagement, Adoption, Retention, and Task success. Each dimension gets a goal, a signal, and a metric.

    For MetricFlow, that might look like:

    • Happiness: NPS score from accounts active 90+ days.
    • Engagement: average sessions per user per week.
    • Adoption: percentage of teams creating 3+ custom views in week one.
    • Retention: 30-day retention by weekly cohort.
    • Task success: pipeline report generation success rate.

    You do not need all five dimensions. Pick the ones that match your stage.

    Common Pitfalls

    Data paralysis. When every decision requires a two-week analysis, you have too many metrics and not enough conviction. Set a small number of metrics you check weekly and make most decisions based on those plus customer feedback.

    Metric gaming. Be careful what you optimize. If you reward engineers for increasing daily active users, they will add notification spam. If you reward them for increasing time-in-app, they will make flows slower. Choose metrics that align with genuine customer value.

    Ignoring qualitative data. Numbers tell you what is happening. Customer interviews tell you why. The best product teams combine both — using analytics to identify patterns and interviews to understand them.

    How to Use With AI

    AI is good at finding patterns in data you might miss.

    Identify leading indicators. Give an AI your retention data alongside feature usage data and ask: “Which behaviors in the first 7 days most strongly predict 30-day retention?” This is the kind of analysis that used to require a data scientist and a week. An AI can surface hypotheses in minutes.

    Build metric definitions. Describe your product and stage to an AI and ask: “What are the 5 most important metrics I should track right now, and why?” Use the output as a starting point, not a final answer — you know your product better than any model.

    The guardrail: AI can find correlations. It cannot tell you which correlations are meaningful. A metric that correlates with retention might be a cause, a symptom, or a coincidence. You still need product judgment to tell the difference.

    Why This Matters

    Good analytics give you confidence. When you know your activation rate is 35% and your target is 50%, you know where to focus. When you can show that a feature increased retention by 8 points, you earn trust with stakeholders. When a metric drops, you catch it in days instead of months.

    Bad analytics — or no analytics — leave you guessing. And guessing is expensive.

    In the 5Ps framework, analytics live in the Product phase but inform every other phase. Your Plan metrics tell you if the strategy is working. Your Problem metrics tell you if you understood the customer. Your Promotion metrics tell you if the go-to-market is effective. Five metrics, well chosen, can cover the entire lifecycle.

    What do you think? I would love to hear what metrics you track and why. Comments are gladly welcome.

  • User Stories

    User Stories

    Early in my career, I thought the job of a product manager was to write perfect specifications. I would spend days crafting 30-page documents, detailing every edge case and error state. I would hand these over to engineering with a sense of pride.

    Then I would watch in horror as they built something completely different.

    The problem wasn’t that I hadn’t written enough. It was that I had written too much, and talked too little.

    This is where User Stories come in. They are deceptively simple, but they are one of the most powerful tools in the Product phase of the 5Ps. When done right, they shift the focus from writing requirements to building shared understanding. (For a broader look at requirements documents, see PRD Templates.)

    What is a User Story?

    A user story is a short, simple description of a feature told from the perspective of the person who desires the new capability, usually a user or customer of the system.

    But here is the important part: a user story is not a specification. It is a placeholder for a conversation.

    Ron Jeffries, one of the creators of Extreme Programming, described the three Cs of a user story:

    1. Card: A physical index card (or Jira ticket) that contains the story text. It is small for a reason—it limits how much you can write.
    2. Conversation: The discussion between the PM, the designer, and the engineer to flesh out the details. This is where the real work happens.
    3. Confirmation: The acceptance criteria that confirm the story is done correctly.

    If you are just writing tickets and throwing them over the wall to engineering, you are missing the point.

    The Standard Formula

    Most teams use a standard template:

    As a [type of user], I want [some goal] so that [some reason].

    It looks rigid, but it forces you to answer three critical questions:

    1. Who are we building this for? (It is rarely just “a user”).
    2. What are they trying to do?
    3. Why does it matter?

    In my experience, the “Why” (the so that clause) is the most critical part. It gives the engineering team context. If they know why a user wants a feature, they can often suggest a better, cheaper, or faster way to solve the problem than what you originally thought of.

    Common Mistakes

    I have written thousands of user stories. Here are the mistakes I see most often (and have made myself):

    1. The Generic User

    “As a user, I want…”

    Who is this user? Is it a first-time visitor? An admin? A frustrated customer trying to cancel? “User” is lazy. Be specific. “As a Finance Manager” or “As a New Subscriber” changes how the team thinks about the solution. This is where your customer segmentation pays off—each segment generates different stories.

    2. The Technical Task in Disguise

    “As a developer, I want to upgrade the database so that the system is faster.”

    This might be a necessary task, but it is not a user story. A user story must deliver value to a human. If you need to do technical work, just call it a “Task” or “Chore.” Don’t force it into the user story format.

    3. Missing the “So That”

    “As a customer, I want to download my transaction history.”

    Why? To file taxes? To check for fraud? To import it into Excel?
    * If it is for taxes, maybe a PDF summary is better.
    * If it is for Excel, a CSV is better.

    Without the “so that,” you are asking your team to guess.

    A Concrete Example

    Let’s look at a bad example and fix it. Imagine we are building a banking app called “BankRight”.

    Bad:

    As a user, I want to reset my password.

    Better:

    As a forgetful account holder, I want to reset my password via a magic link sent to my email so that I can regain access without remembering security questions.

    Notice the difference? The second one tells us who (someone who forgot), how (magic link, implying a specific solution direction), and why (avoiding the friction of security questions).

    The INVEST Criteria

    When I am reviewing stories for BankRight, I use the INVEST mnemonic to check if they are ready for development. I didn’t invent this (Bill Wake did), but I use it all the time.

    • Independent: Can this be built and deployed by itself?
    • Negotiable: Is there room for discussion? (Remember: it’s a conversation).
    • Valuable: Does it provide value to the customer?
    • Estimable: Is it clear enough for engineers to guess how long it will take?
    • Small: Can it be done in a few days? If it takes two weeks, it’s too big. Break it down.
    • Testable: How will we know it works?

    Acceptance Criteria: The Guardrails

    While the story itself describes the intent, the Acceptance Criteria (AC) describe the constraints. This is where you get specific.

    For our BankRight password reset story, the AC might look like:
    * [ ] Link expires after 15 minutes.
    * [ ] Link can only be used once.
    * [ ] User receives a confirmation email after the change.
    * [ ] Old password cannot be reused.

    I try to write these as a checklist. It makes it easy for the QA team (and the developer) to verify their work.

    How to Use With AI

    Writing user stories is one of the best use cases for Generative AI. It excels at structure, variation, and edge case detection. But remember: AI is the facilitator, not the decision maker. You own the context.

    Here is how I use AI to speed up my user story writing process:

    1. Draft the First Pass

    Don’t start from a blank screen. Paste your raw notes or a transcript of a stakeholder meeting and ask the AI to draft stories.

    Prompt:

    “I am a PM for a banking app. We are building a feature to let users freeze their debit cards instantly. Based on these meeting notes, draft 5 user stories in the standard format (As a… I want… So that…).”

    2. Generate Acceptance Criteria

    This is where AI saves me hours. It often thinks of negative paths I might miss.

    Prompt:

    “Here is a user story: ‘As a cardholder, I want to freeze my card so that no new transactions are approved.’ List 10 acceptance criteria for this story. Include happy path, error states, and security considerations.”

    3. Split Large Stories

    If a story feels too big (it fails the “Small” in INVEST), ask AI to break it down.

    Prompt:

    “This user story seems too large for a single sprint: ‘As an admin, I want to manage all user permissions.’ Split this into 3-5 smaller, independent vertical slices that still deliver value.”

    The Guardrail

    Always review the output. AI tends to be generic (“As a user…”). You must enforce specificity (“As a Fraud Analyst…”). Also, AI will not know your technical constraints unless you tell it. If you can’t build magic links yet, don’t let the AI put it in the story.

    Conclusion

    Writing great user stories is a craft. It takes practice to balance brevity with clarity. But remember: the goal isn’t to write the perfect sentence. The goal is to create a shared understanding so your team can build the right thing.

    Start with the conversation. The ticket is just the receipt.

    What about you? How does your team handle requirements? Do you use the standard format or something else? Comments are gladly welcome.

  • Minimum Viable Product

    Minimum Viable Product

    I once spent six months building a product that had everything. A dashboard, customizable reports, role-based permissions, an API, email digests. We launched it to three enterprise customers. They looked at it and said, “This is nice, but can it just send us a weekly CSV?”

    Six months. They wanted a CSV.

    That was the moment I truly understood what a Minimum Viable Product is — and more importantly, what it is not. It is not a cheap version of your final product. It is the smallest thing you can build to learn whether you are solving a real problem. And that distinction changes everything about how you approach the Product phase of building.

    What Is an MVP?

    Eric Ries introduced the term in The Lean Startup. His definition: an MVP is the version of a new product which allows a team to collect the maximum amount of validated learning about customers with the least effort.

    The key phrase is “validated learning.” An MVP is not a product strategy. It is a learning strategy. You are not trying to impress customers. You are trying to answer a question: does this problem matter enough that someone will change their behavior to solve it?

    This is a subtle but critical point. If your MVP is designed to wow people, you have already missed the purpose. It is designed to teach you something you did not know.

    The Three Components of a Good MVP

    In my experience, a good MVP has three qualities:

    1. It Tests a Specific Hypothesis

    Before you build anything, write down what you believe. “We believe that busy professionals will pay $15/month for automated meal planning because they spend too much time deciding what to cook.” That is your hypothesis. Your MVP exists to prove or disprove it. Nothing else.

    2. It Delivers Real Value (However Small)

    An MVP is not a mockup or a slideshow. It must do something real for a real person. A landing page that collects email addresses is a test, not an MVP. A spreadsheet that generates a weekly meal plan based on dietary preferences — that is an MVP. It is small, but it solves the problem.

    3. It Has a Feedback Mechanism

    If you build something and nobody uses it, you have learned nothing. Your MVP needs a way to observe behavior. Do people come back? Do they share it? Do they complain about specific things? Build the feedback loop into the product from day one.

    A Concrete Example: MealPlan

    Let me walk through a fictional example. Imagine you are a PM at a startup called “MealPlan.” Your thesis is that working parents waste hours each week deciding what to cook and shopping for ingredients.

    You have already done your customer segmentation and identified your primary persona: dual-income parents with kids under 10, living in urban areas, ordering takeout three or more times per week because they are too tired to plan meals.

    You have also run customer interviews and confirmed that the pain is real. People say things like, “I know I should cook more. I just can’t deal with the planning part.”

    So what is the MVP? Here is what it is not: a full app with recipe search, grocery integration, nutritional tracking, and family preference profiles. That is a product roadmap. That is six months of work. And you do not yet know if anyone will actually use a meal planning tool.

    Here is what it could be: a simple web form where a user enters their family size, dietary restrictions, and budget. Every Sunday, MealPlan emails them a plan for five dinners and a consolidated grocery list. That is it. No app. No login. No recipe photos.

    This version tests the core hypothesis: will busy parents use a tool that removes the “what should we cook?” decision? If they do, you know you are on to something. If they don’t open the emails, you have learned something equally valuable — and you spent weeks, not months, finding out.

    The “Minimum” Trap

    The biggest mistake I see teams make with MVPs is arguing about “minimum.” Someone says, “We can’t launch without onboarding.” Someone else says, “We need a proper design, or nobody will take us seriously.” Before you know it, the “minimum” viable product has 40 features and a six-month timeline.

    Here is the test I use: if you are comfortable with your MVP, it is probably too big. Ries was not exaggerating when he wrote that the MVP should feel embarrassing. Reid Hoffman, co-founder of LinkedIn, put it this way: if you are not embarrassed by the first version, you launched too late. (He shared this on a Stanford lecture as part of Sam Altman’s startup course.)

    The point is not to ship garbage. The point is to ship the smallest thing that generates real learning. Polish does not generate learning. Features do not generate learning. Putting something in front of a real human and watching what happens — that generates learning.

    Common MVP Formats

    There is no single right way to build an MVP. The format depends on your hypothesis:

    • Concierge MVP: You do the work manually for a small group of customers. MealPlan’s founders could create meal plans by hand for 20 families and email them personally. No technology required.
    • Wizard of Oz MVP: The customer sees a product, but behind the scenes, a human is doing the work. The interface looks automated, but it isn’t yet.
    • Single-Feature MVP: You build one feature and ship it. Not the full product — just the one thing that tests the hypothesis.
    • Pre-order MVP: You describe the product, set a price, and see if anyone pays before you build it. Crowdfunding platforms like Kickstarter are essentially MVP machines.

    Each format has trade-offs. A concierge MVP gives you the deepest customer insight but does not scale. A single-feature MVP scales but might not reveal whether the core problem resonates.

    Why MVP Matters for Product Managers

    In the 5Ps framework, MVP sits at the heart of the Product phase. It is the bridge between understanding a problem (the Problem phase) and building a scalable solution.

    Without an MVP mindset, teams fall into two traps. The first is building too much — investing months in features nobody asked for because they assumed they knew what customers wanted. The second is building too little — running surveys and collecting opinions but never putting a real product in front of anyone.

    An MVP forces you to commit. You have to pick a hypothesis, build something real, and face the market’s reaction. That is uncomfortable. But it is also the fastest path to a product people actually want.

    How to Use With AI

    AI is a strong companion for MVP work. It can help you move faster through the early stages without cutting corners on thinking.

    1. Sharpen Your Hypothesis

    Before writing a line of code, test your thinking. Describe your target customer and the problem, then ask the AI to poke holes.

    Prompt: “I believe busy parents will pay for automated meal planning. Here is my customer segment and interview insights. What assumptions am I making that I haven’t validated? What could go wrong?”

    2. Generate MVP Scope Options

    Once you know what to test, ask for multiple ways to test it — not just the one you already thought of.

    Prompt: “Here is my hypothesis: [hypothesis]. Suggest 5 different MVP formats I could use to test this, ranging from no-code to a simple coded prototype. For each, estimate the effort and what I would learn.”

    3. Write User Stories for the MVP

    With your MVP scope decided, generate the user stories to build it. AI is excellent at catching edge cases you miss.

    Prompt: “Here is my MVP: a web form that generates a weekly meal plan. Write 8 user stories in the standard format. Include the ‘so that’ clause. Focus only on the MVP — do not add features beyond the core flow.”

    The Guardrail: AI can generate options all day. But it cannot tell you which hypothesis matters most. It does not know your market, your budget, or your team’s strengths. Use AI to expand your thinking, then apply your judgment to narrow it down. The decision is yours.

    Conclusion

    Building an MVP is an act of discipline. It is the discipline to stop adding features and start learning. It is the discipline to ship something small and watch what happens, even when your instinct is to make it perfect first.

    The goal is not to build the smallest product. It is to find the fastest path to the truth about your customers. Sometimes that is a web form. Sometimes it is a spreadsheet. Sometimes it is you, manually doing the work for 20 people and seeing if they come back for more.

    Start with one hypothesis. Build the smallest thing that tests it. Watch what people do, not what they say. Then decide what to build next.

    What has your experience been with MVPs? I would love to hear about it. Comments are gladly welcome.