A few years ago, I inherited a product with a beautiful analytics dashboard. Fifty-three metrics, real-time updates, color-coded trends. The team was proud of it. When I asked which three metrics mattered most for our next decision, nobody could answer.
That is the analytics trap. Measuring everything is easy. Measuring what matters is hard. And the difference between the two is the difference between a team that makes decisions and a team that makes dashboards.
Vanity Metrics vs. Actionable Metrics
A vanity metric is a number that goes up and makes you feel good but does not inform a decision. Total registered users is a vanity metric — it never goes down, and it does not tell you whether anyone is getting value from your product.
An actionable metric tells you something you can respond to. Weekly active users who complete a core action is actionable — if it drops, you investigate. If it rises after a change, you know the change worked.
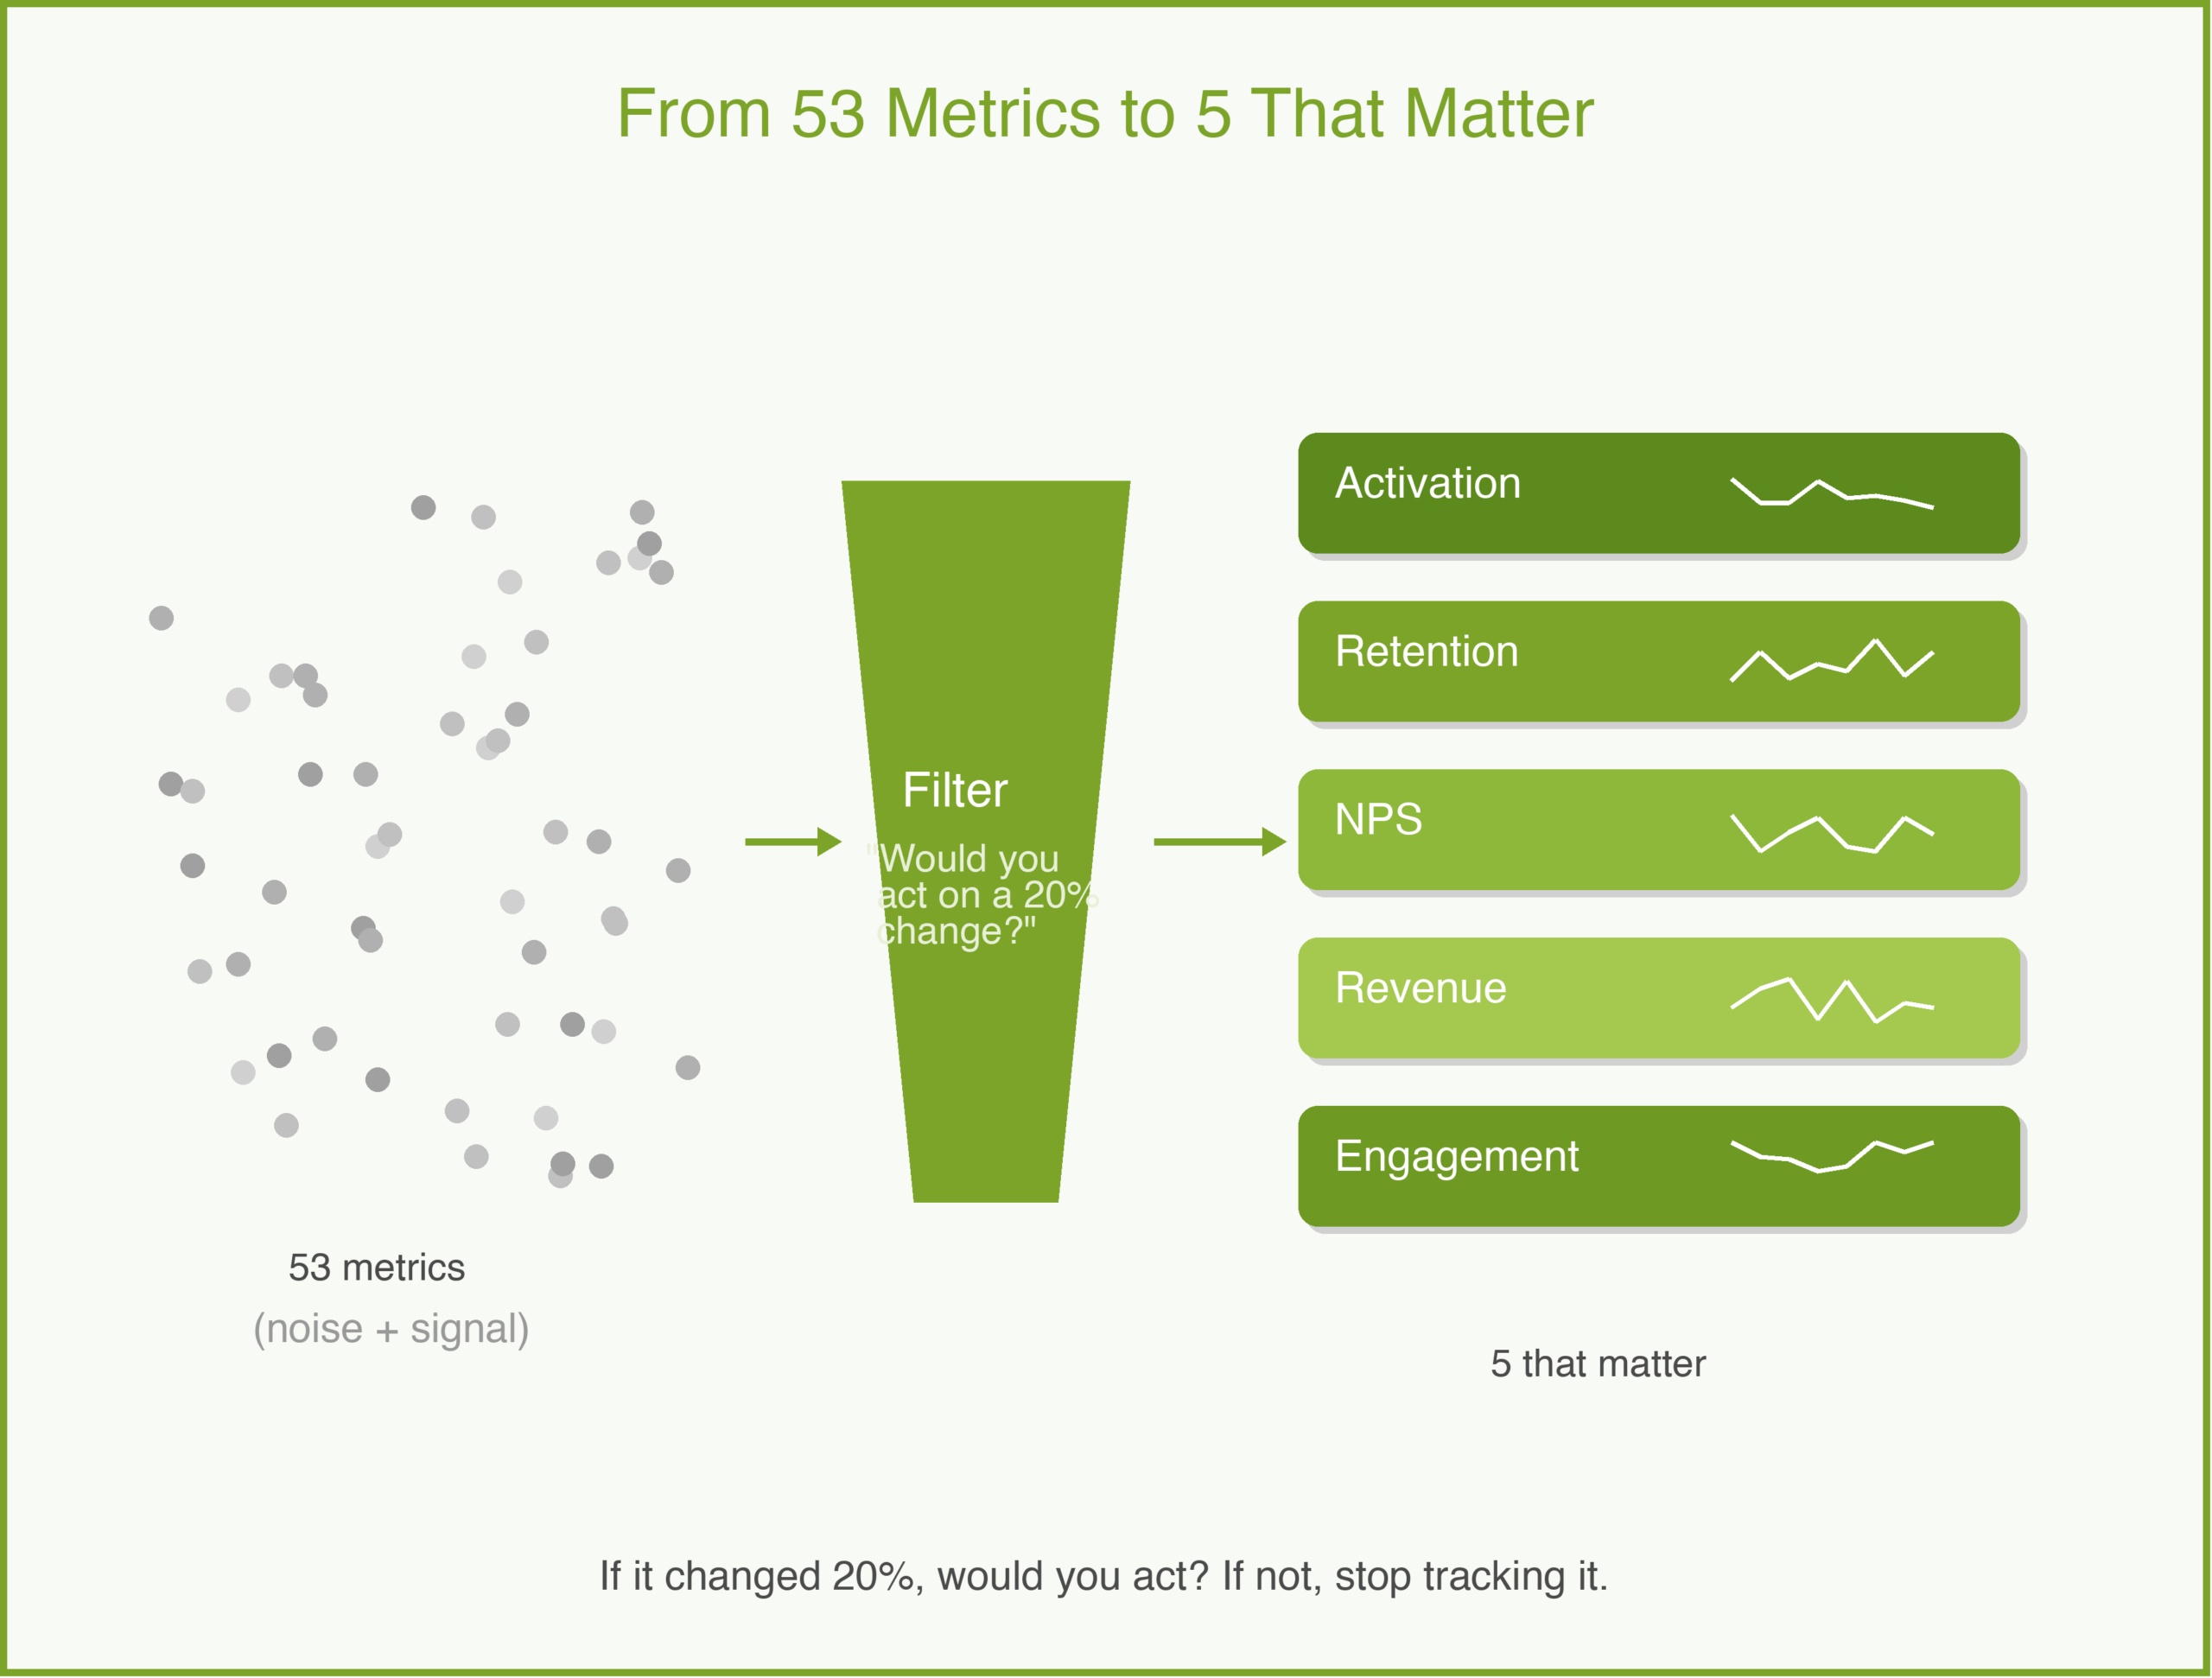
The test is simple: if this metric changed by 20% tomorrow, would you do something different? If yes, it is actionable. If no, it is vanity. Stop tracking it.
Metrics by Product Stage
The right metrics change as your product matures. What matters at launch is different from what matters at scale.
Pre-launch and early access. You are looking for signals that people care. Track activation rate (what percentage of signups complete the core action?), time-to-value (how long from signup to first meaningful use?), and qualitative feedback volume. At this stage, one customer using your product daily is more valuable than a thousand signups.
Growth stage. Retention is the only metric that matters. If people come back, you have something. If they do not, no amount of acquisition will save you. Track weekly or monthly retention cohorts, not just averages. A 40% month-one retention that drops to 5% by month three tells a different story than a steady 25%.
Maturity and scale. Revenue metrics take center stage. Customer lifetime value (LTV — total revenue from a customer over their relationship with you), customer acquisition cost (CAC — what you spend to win each customer), and the ratio between them tell you whether your business model works. Net revenue retention tells you whether existing customers are expanding or shrinking. At this stage, you are optimizing a machine, not searching for signal.
An Example: MetricFlow
MetricFlow is a fictional B2B tool that helps sales teams track pipeline health. At launch, the team tracks everything — page views, clicks, time on page, feature usage for all 12 features, daily active users, weekly active users, monthly active users.
Their dashboard is crowded and nobody uses it. So they ask: what is the one thing that tells us whether a customer is getting value?
After analyzing churned vs. retained accounts, they find a strong predictor: teams that create at least 3 custom pipeline views in their first week retain at 4x the rate of teams that do not. That becomes their North Star — “first-week custom views.” Every product decision gets tested against it: does this change make it more likely that a new team creates 3 custom views in week one?
Their dashboard goes from 53 metrics to 5. Weekly new teams. First-week activation rate. Custom views created. 30-day retention by cohort. NPS from accounts past 90 days. Everything else is available in the data warehouse if someone needs it, but it is not on the dashboard.
The HEART Framework
One framework I have found useful is Google’s HEART framework, first described by Kerry Rodden, Hilary Hutchinson, and Xin Fu in their original 2010 paper: Happiness, Engagement, Adoption, Retention, and Task success. Each dimension gets a goal, a signal, and a metric.
For MetricFlow, that might look like:
- Happiness: NPS score from accounts active 90+ days.
- Engagement: average sessions per user per week.
- Adoption: percentage of teams creating 3+ custom views in week one.
- Retention: 30-day retention by weekly cohort.
- Task success: pipeline report generation success rate.
You do not need all five dimensions. Pick the ones that match your stage.
Common Pitfalls
Data paralysis. When every decision requires a two-week analysis, you have too many metrics and not enough conviction. Set a small number of metrics you check weekly and make most decisions based on those plus customer feedback.
Metric gaming. Be careful what you optimize. If you reward engineers for increasing daily active users, they will add notification spam. If you reward them for increasing time-in-app, they will make flows slower. Choose metrics that align with genuine customer value.
Ignoring qualitative data. Numbers tell you what is happening. Customer interviews tell you why. The best product teams combine both — using analytics to identify patterns and interviews to understand them.
How to Use With AI
AI is good at finding patterns in data you might miss.
Identify leading indicators. Give an AI your retention data alongside feature usage data and ask: “Which behaviors in the first 7 days most strongly predict 30-day retention?” This is the kind of analysis that used to require a data scientist and a week. An AI can surface hypotheses in minutes.
Build metric definitions. Describe your product and stage to an AI and ask: “What are the 5 most important metrics I should track right now, and why?” Use the output as a starting point, not a final answer — you know your product better than any model.
The guardrail: AI can find correlations. It cannot tell you which correlations are meaningful. A metric that correlates with retention might be a cause, a symptom, or a coincidence. You still need product judgment to tell the difference.
Why This Matters
Good analytics give you confidence. When you know your activation rate is 35% and your target is 50%, you know where to focus. When you can show that a feature increased retention by 8 points, you earn trust with stakeholders. When a metric drops, you catch it in days instead of months.
Bad analytics — or no analytics — leave you guessing. And guessing is expensive.
In the 5Ps framework, analytics live in the Product phase but inform every other phase. Your Plan metrics tell you if the strategy is working. Your Problem metrics tell you if you understood the customer. Your Promotion metrics tell you if the go-to-market is effective. Five metrics, well chosen, can cover the entire lifecycle.
What do you think? I would love to hear what metrics you track and why. Comments are gladly welcome.